반응형
1. 그래프 단계(셀로판지 개념)
1단계 : 배경 설정(축)
2단계 : 그래프 추가(점, 막대, 선)
3단계 : 설정 추가(축 범위, 색, 표식)
2. Sample Data Base
Daedeok = [81, 70, 94, 91, 74, 78, 80, 81, 75, 89, 102, 110]
Donggu = [84, 82, 86, 89, 75, 91, 100, 88, 108, 111, 88, 77]

label = ['1월', '2월', '3월', '4월', '5월', '6월', '7월', '8월', '9월', '10월', '11월', '12월']
3. Sample Code
from matplotlib import pyplot
import numpy

Daedeok = [81, 70, 94, 91, 74, 78, 80, 81, 75, 89, 102, 110]
Donggu = [84, 82, 86, 89, 75, 91, 100, 88, 108, 111, 88, 77]

label = ['1월', '2월', '3월', '4월', '5월', '6월', '7월', '8월', '9월', '10월', '11월', '12월']

pyplot.rcParams["font.family"] = 'Malgun Gothic'
pyplot.rcParams["font.size"] = 12
pyplot.rcParams["figure.figsize"] = (12, 8)

pyplot.figure()

x = numpy.arange(len(label))

pyplot.bar(x-0.0, Daedeok, label='대덕구', width=0.2, color='#dd0000')
pyplot.bar(x+0.2, Donggu, label='동구', width=0.2, color='#ddff00')
pyplot.xticks(x, label)

pyplot.legend()
pyplot.xlabel('월')
pyplot.ylabel('교통사고 수')
pyplot.ylim(0, 150)
pyplot.title('2016년 대덕구/동구 월별 교통사고')

pyplot.savefig('ti.png')

pyplot.close()
4. Sample Code 풀이
- 한글 폰트 전역 설정
pyplot.rcParams['font.family'] = 'NanumGothic'
- 한글 폰트 사이즈 전역 설정
pyplot.rcParams["font.size"] = 12
- 차트의 크기 전역 설정
pyplot.rcParams["figure.figsize"] = (12, 8)
- 그래프 설정 시작
pyplot.figure()
- 기준축에 대한 좌표 배열 생성
x = numpy.arange(len(label))
- 기준측의 좌표와 굵기를 설정 / numpy를 사용하여 연산을 수행
pyplot.bar(x-0.0, Daedeok, label='대덕구', width=0.2, color='#dd0000')
pyplot.bar(x+0.2, Donggu, label='동구', width=0.2, color='#ddff00')
- 좌표에 지정될 라벨 설정
pyplot.xticks(x, label)
- 범주 표시
pyplot.legend()
- 기준축( X 축) 라벨 설정
pyplot.xlabel('월')
- 데이터축(Y 축) 라벨 설정
pyplot.ylabel('교통사고 수')
- 데이터축 범위 설정
pyplot.ylim(0, 150)
- 그래프 제목
pyplot.title('2016년 대덕구/동구 월별 교통사고')
- 출력물 파일 지정
pyplot.savefig('ti.png')
- 그래프 종료
pyplot.close()
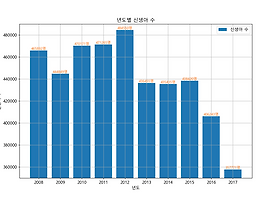
5. 출력물

반응형
'Python_Intermediate > Matplotilb' 카테고리의 다른 글
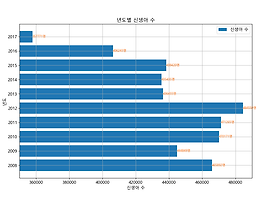
| Python Matplotlib - 가로 막대 그래프 기초 2 (0) | 2019.05.10 |
|---|---|
| Python Matplotlib - 가로 막대 그래프 기초 1 (0) | 2019.05.10 |
| Python Matplotlib - 세로 막대 그래프 기초 2 (0) | 2019.05.09 |
| Python Matplotlib - 세로 막대 그래프 기초 1 (0) | 2019.05.08 |
| Python Matplotlib - 선 그래프 한글 폰트 적용 (0) | 2019.05.08 |