반응형
1. Matplotlib
자료를 차트나 플롯 형식으로 시각화 패키지
다양한 시각화 기능 제공
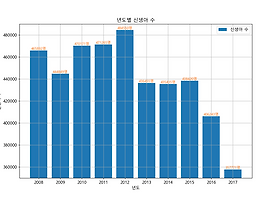
2. 세로 막대 그래프
집단간의 차이를 표현
평균 막대 그래프
3. 설치
pip install matplotlib
4. Pyplot 모듈 로드
from matplotlib import pyplot
5. 기본 구조
from matplotlib import pyplot

Reference_axis = [1, 2, 3, 4]
Value_axis = [10, 20, 30 , 40]

pyplot.figure()

pyplot.bar(Reference_axis, Value_axis)

pyplot.show()

pyplot.close()
6. 기본 구조 정리
- 기준축 DB 설정(X축)
Reference_axis = [1, 2, 3, 4]
- 데이터축 DB 설정(Y축)
Value_axis = [10, 20, 30 , 40]
- 그래프 설정 시작
pyplot.figure()
- 기준축 / 데이터 축 세로 막대 그래프 표현
pyplot.bar(Reference_axis, Value_axis)
- 데이터 시각화 표현
pyplot.plot(data)
- 그래프 표시
pyplot.show()
- 그래프 종료(설정 해제)
pyplot.close()
7. 출력물

반응형
'Python_Intermediate > Matplotilb' 카테고리의 다른 글
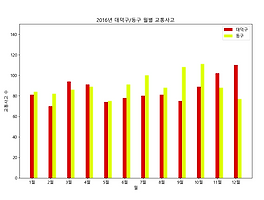
| Python Matplotlib - 세로 막대 그래프 기초 3(다중 막대 그래프) (0) | 2019.05.09 |
|---|---|
| Python Matplotlib - 세로 막대 그래프 기초 2 (0) | 2019.05.09 |
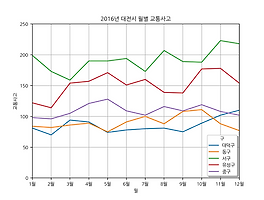
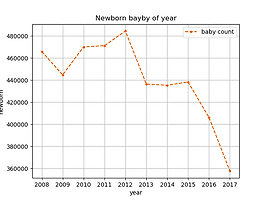
| Python Matplotlib - 선 그래프 한글 폰트 적용 (0) | 2019.05.08 |
| Python Matplotlib - 선 그래프 기초 2 (0) | 2019.05.08 |
| Python Matplotlib - 선 그래프 기초 1 (0) | 2019.05.07 |