반응형
1. 그래프 단계(셀로판지 개념)
1단계 : 배경 설정(축)
2단계 : 그래프 추가(점, 막대, 선)
3단계 : 설정 추가(축 범위, 색, 표식)
2. Sample Data Base
newborn = [465892, 444849, 470171, 471265, 484550, 436455, 435435, 438420, 406243, 357771]
year = [2008, 2009, 2010, 2011, 2012, 2013, 2014, 2015, 2016, 2017]
3. Sample Code
from matplotlib import pyplot

newborn = [465892, 444849, 470171, 471265, 484550, 436455, 435435, 438420, 406243, 357771]
year = [2008, 2009, 2010, 2011, 2012, 2013, 2014, 2015, 2016, 2017]

pyplot.rcParams["font.family"] = 'Malgun Gothic'
pyplot.rcParams["font.size"] = 12
pyplot.rcParams["figure.figsize"] = (12, 8)

pyplot.barh(year, newborn, label='신생아 수')
pyplot.legend()
pyplot.ylabel('년도')
pyplot.xlabel('신생아 수')
pyplot.xlim(350000, 490000)
pyplot.title('년도별 신생아 수')
pyplot.yticks(year)
pyplot.grid()

for i, v in enumerate(year):
    str_val = "%d명" % newborn[i]
    pyplot.text(newborn[i], v, str_val, fontsize=9, color='#ff6600',
                horizontalalignment='left', verticalalignment='center')

pyplot.savefig('newbone1.png')

pyplot.close()
4. Sample Code 풀이
- 한글 폰트 전역 설정
pyplot.rcParams['font.family'] = 'NanumGothic'
- 한글 폰트 사이즈 전역 설정
pyplot.rcParams["font.size"] = 12
- 차트의 크기 전역 설정
pyplot.rcParams["figure.figsize"] = (12, 8)
- 그래프 설정 시작
pyplot.figure()
- 막대 그래프 표현
pyplot.barh(year, newborn, label='신생아 수')
- 범주 표시
pyplot.legend()
- 기준축( Y 축) 라벨 설정
pyplot.ylabel('년도')- 데이터축( X 축) 라벨 설정
pyplot.xlabel('신생아 수')- 데이터축 범위 설정
pyplot.xlim(350000, 490000)
- 그래프 제목
pyplot.title('년도별 신생아 수')
- 좌표에 지정될 라벨 설정
pyplot.yticks(year)
- 그리드(격자) 생성
pyplot.grid()
- 수치 값 텍스트 표현
for i, v in enumerate(year):
    str_val = "%d명" % newborn[i]
    pyplot.text(newborn[i], v, str_val, fontsize=9, color='#ff6600',
                horizontalalignment='left', verticalalignment='center')
horizontalalignment(가로방향) : left, center, right
verticalalignment(세로방향) : top, center, bottom
- 출력물 파일 지정
pyplot.savefig('newbone1.png')- 그래프 종료
pyplot.close()
5, 출력물

반응형
'Python_Intermediate > Matplotilb' 카테고리의 다른 글
| Python Matplotlib - Figure(Pyplot 화면 안내) (0) | 2019.05.10 |
|---|---|
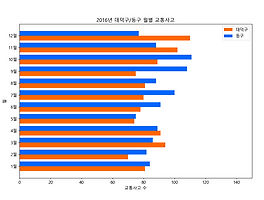
| Python Matplotlib - 가로 막대 그래프 기초 3(다중 막대 그래프) (0) | 2019.05.10 |
| Python Matplotlib - 가로 막대 그래프 기초 1 (0) | 2019.05.10 |
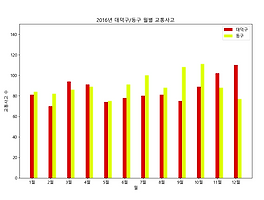
| Python Matplotlib - 세로 막대 그래프 기초 3(다중 막대 그래프) (0) | 2019.05.09 |
| Python Matplotlib - 세로 막대 그래프 기초 2 (0) | 2019.05.09 |