 Python Matplotlib - 세로 막대 그래프 기초 3(다중 막대 그래프)
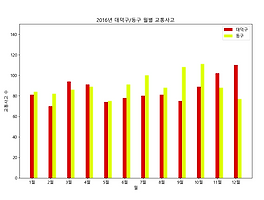
1. 그래프 단계(셀로판지 개념)1단계 : 배경 설정(축)2단계 : 그래프 추가(점, 막대, 선)3단계 : 설정 추가(축 범위, 색, 표식) 2. Sample Data BaseDaedeok = [81, 70, 94, 91, 74, 78, 80, 81, 75, 89, 102, 110] Donggu = [84, 82, 86, 89, 75, 91, 100, 88, 108, 111, 88, 77] label = ['1월', '2월', '3월', '4월', '5월', '6월', '7월', '8월', '9월', '10월', '11월', '12월'] 3. Sample Codefrom matplotlib import pyplot import numpy Daedeok = [81, 70, 94, 91, 74, 78, 80..
 Python Matplotlib - 세로 막대 그래프 기초 2
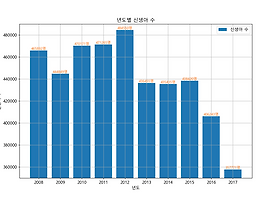
1. 그래프 단계(셀로판지 개념)1단계 : 배경 설정(축)2단계 : 그래프 추가(점, 막대, 선)3단계 : 설정 추가(축 범위, 색, 표식) 2. Sample Data Basenewborn = [465892, 444849, 470171, 471265, 484550, 436455, 435435, 438420, 406243, 357771] year = [2008, 2009, 2010, 2011, 2012, 2013, 2014, 2015, 2016, 2017] 3. Sample Codefrom matplotlib import pyplot newborn = [465892, 444849, 470171, 471265, 484550, 436455, 435435, 438420, 406243, 357771] year =..